


Overview
Geologically the valley has the richest gold production in the world of the greenstone gold formation. Assay results conducted by several groups since 1934 have also shown the viability of the mine. The Mine has a total of 17 blocks of Gold Reef, 7 blocks of Gold Dumps and 1 block of Chrome. These blocks measure approximately 250 hectares with a strike of 2.8 kilometers. The mine has, indicated by diamond drilling and underground development, the potential of 1,200,000 tons of ore at 5 grams/ton, an inferred 1,000,000 tons of ore at 4 grams/ton and actual 500,000 tons at 5.5grams/ton in the mine underground to level 7 elevation. Of the potential of the oniferous area of the proven mine, only 20% has been investigated and mined out of which 2,071,175 tons have been taken and a production of 19,585 kg of gold have been produced refer to Table 1 attached below. It is estimated that the ancient miners removed approximately 10 tons of gold. The mine has about 22 levels of underground mining tunnels that have been mined to level 18 with a potential of ±250kilometers of new development.
The current estimated value proven is U.S. $3.3 Billion which excludes 75% of hydrothermal discovery; however, this includes ore dumps of 141,000 tons/±3.5g that are ready to be milled.
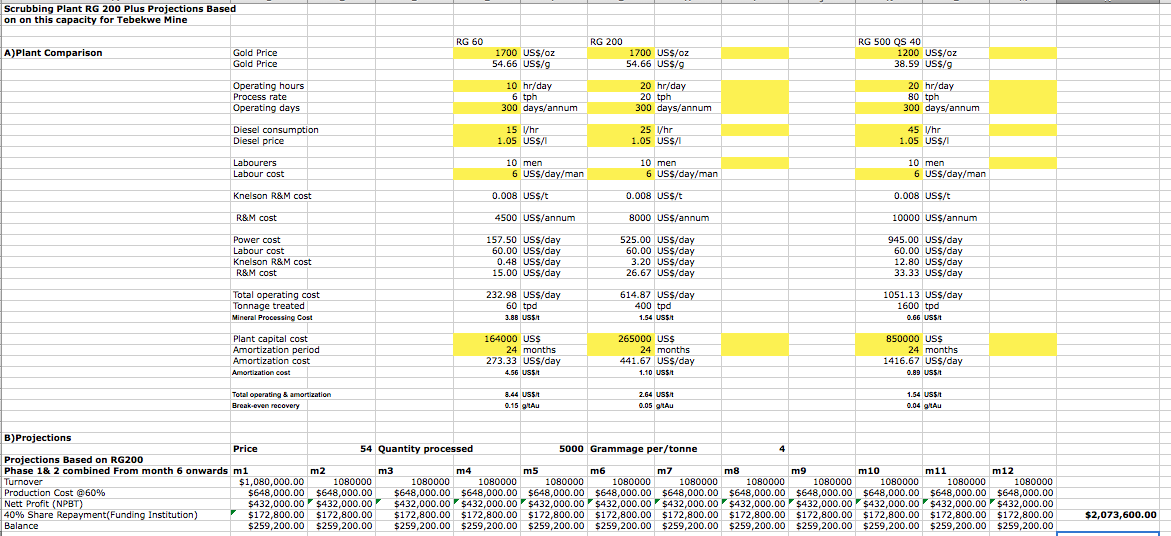
The mine Sands will follow a three phased approach to reach a desired 20kg per week production:
Phase 1:
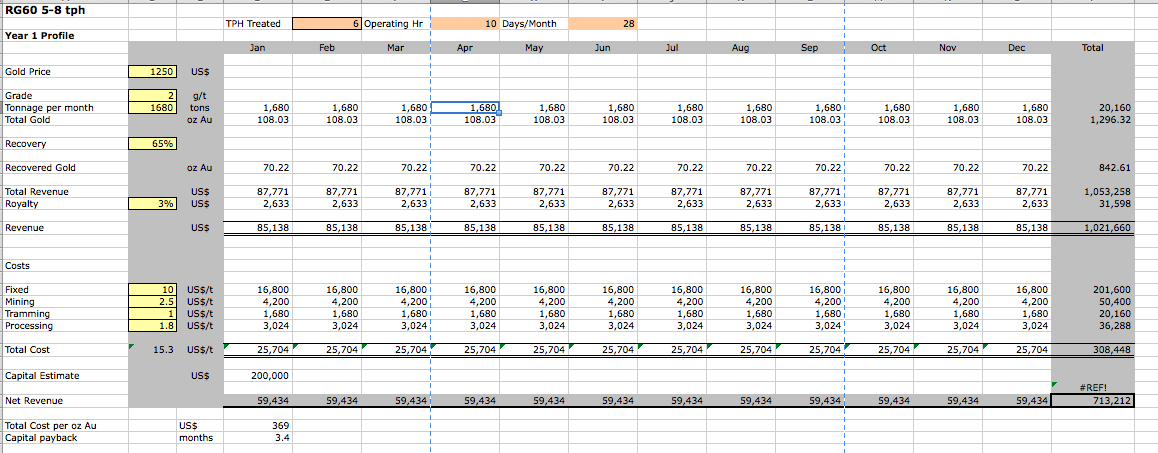
Increase processing from the current processing to 2500 tons/2.5-3g a month (6.5-±7.5kg).
Phase 2:
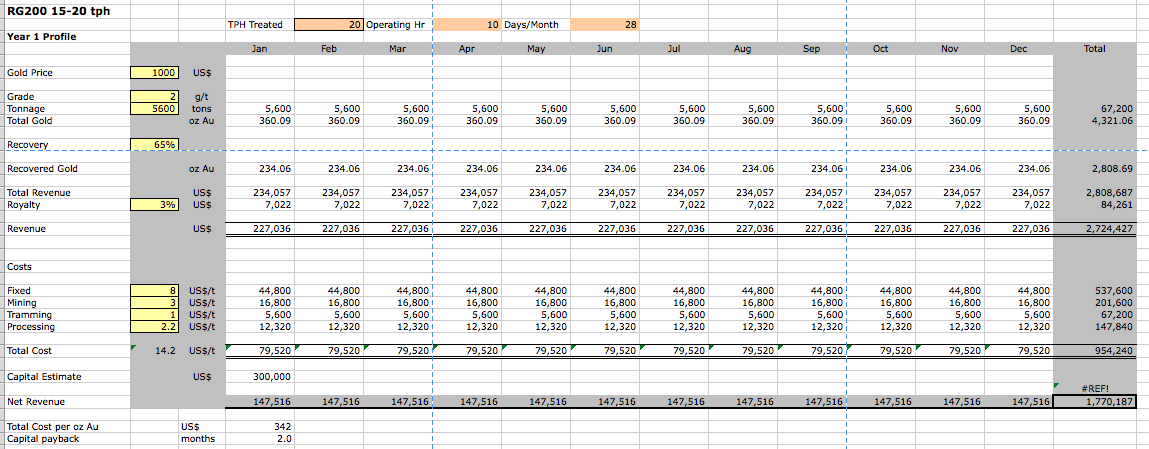
At this stage our target will be to increase production from 2500 tons to ±5000 tons (13-±15kg) and building reserves of stock dumps.
Phase 3:
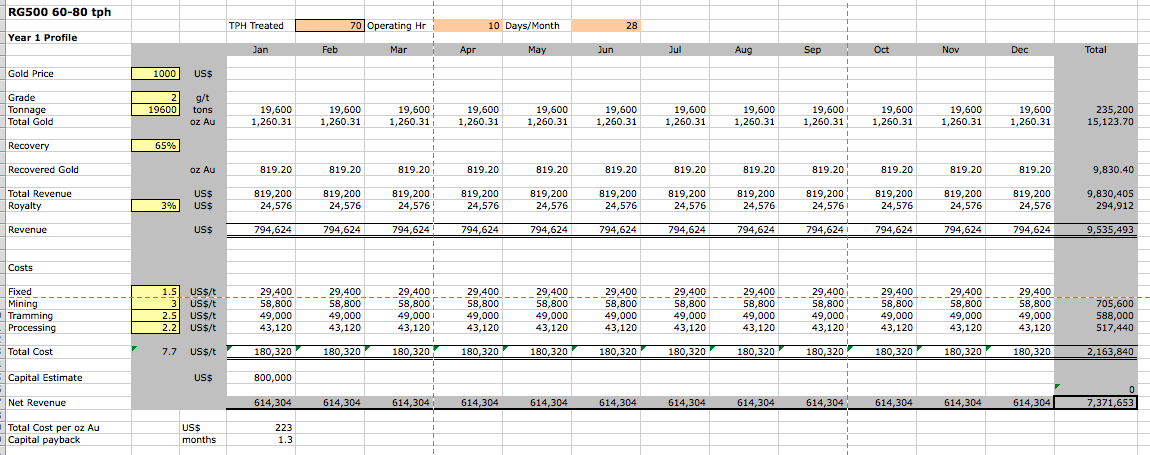
The introduction and commissioning of the new plant with a capacity of 20,000 tons/m which will see produce ± 80kg/m of gold.
Whilst our focus is to maximize production and contribute significantly in the mining industry of Zimbabwe with the potential to create employment in the form of ±550 permanent positions, our main focus is intended to increase revenue by increasing production at the mine which will increase turnover from the current turnover of U.S. $250 000.00 per year to over U.S. $38 400 000.00 ($38.4million) (a production of 80kg/m or 20kg/week or 2.85kg/day or 118.75g/h.
| Miner | Period | Tons | Kg gold won | Recovery grade |
| Selukwe Gold Mining Comp. |
1898-1971 |
734465t |
11269 |
15,34 g/t |
| Lonhro |
1931-57 |
1168326t |
7363 |
6,30 g/t |
| R Hawkins |
1958-67 |
39000t |
425 |
1090 g/t |
| Nome Gold |
1981-91 |
10800t |
210 |
19,44 g/t |
| Gigantic Mines |
1993-96 |
118584t |
318 |
2.68 g/t |
| Total |
1898-1996 |
2071175t |
19585 |
9,46 g/t |
Table 1: Mine’s Production 1898-1996
Table 2: Mines in the Valley and Production to date
| Mine | Tons | Production | Total Production |
| Wonderland Group | 154509 | 7.06 | 1091 kg |
| Yankee Doodie | 206145 | 8.0 | 1650 kg |
| Wolfshall | 103009 | 16.43 | 1693 kg |
| S Bonson Mine | 159703 | 6.8 | 1086 kg |
| Oceana Green | 74884 | 7.0 | 336 kg |
| Bonson | 159703 | 4.7 | 751 kg |
| Moonie Creek | 80503 | 4.6 | 371 kg |
| Knights Mine | 107062 | 4.2 | 450 kg |
| Johannes Luck Mine | 1096 | 10.7 | 12 kg |
| Glen Roza | 37856 | 13.0 | 493 kg |
| Dunraven Mine | 262030 | 5.1 | 1337 kg |
| Total | 1346500 | 8 g/t | 9453 kg |